PSCU, the nation’s premier payments credit union service organization, has updated its weekly transaction analysis from its Owner credit union members on a same-store basis to identify the impact of COVID-19 on consumer spending and shopping trends. An infographic is also attached.
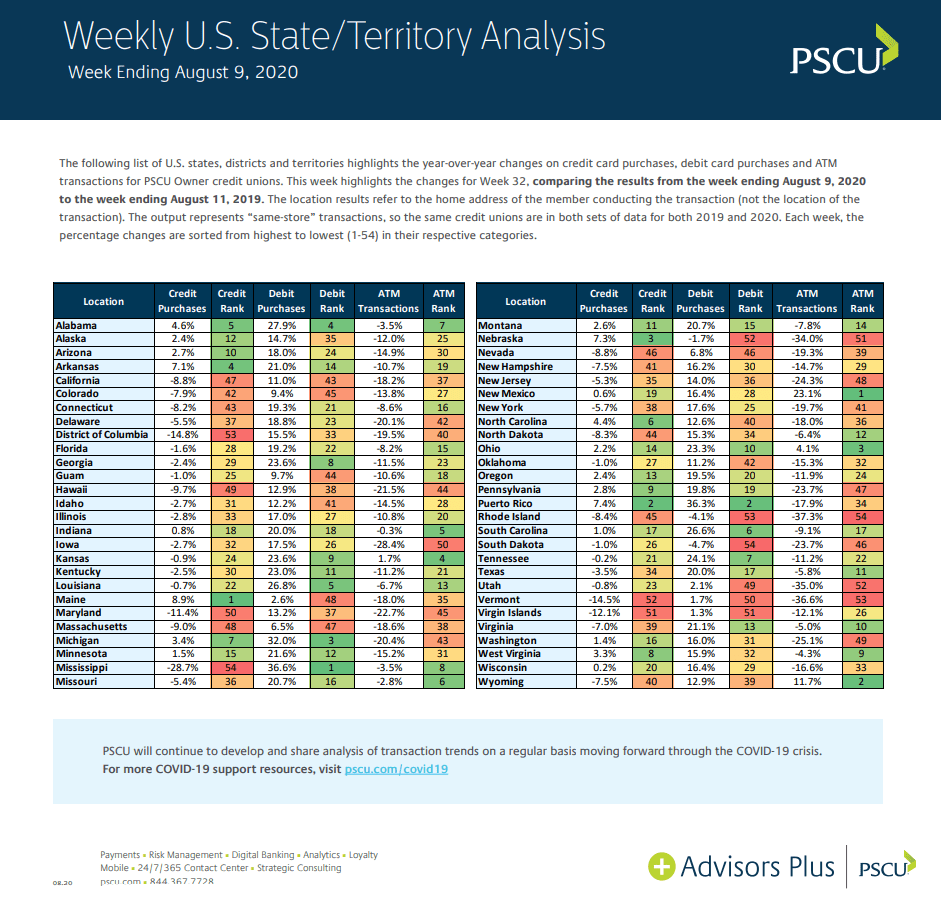
To provide relevant updates on market performance, experts from PSCU’s Advisors Plus and Data & Analytics teams today released year-over-year weekly performance data trends. In this week’s installment, PSCU compares the 32nd week of the year (the week ending August 9, 2020 compared to the week ending August 11, 2019).
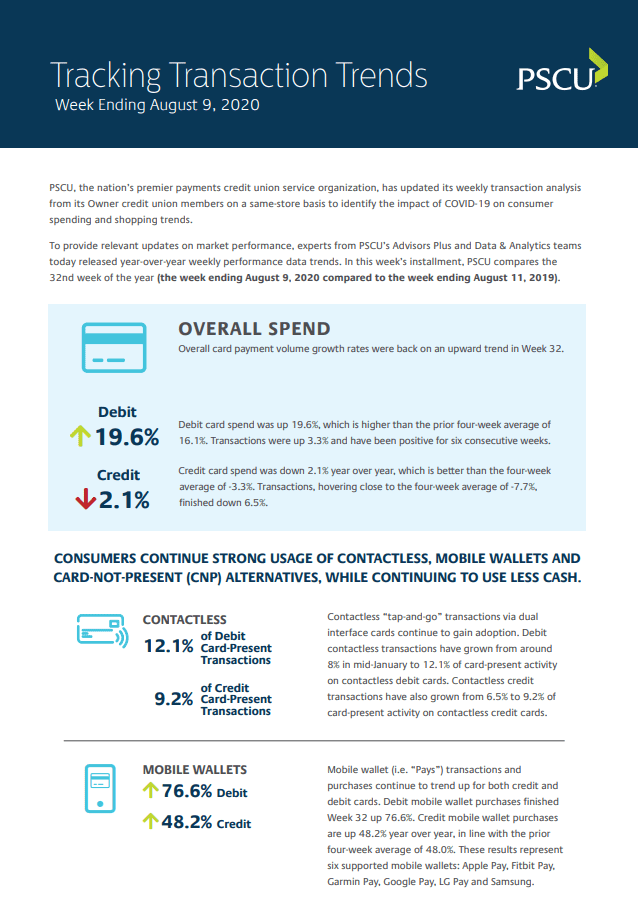
- Overall card payment volume growth rates were back on an upward trend in Week 32.
- Debit card spend was up 19.6%, which is higher than the prior four-week average of 16.1%. Transactions were up 3.3% and have been positive for six consecutive weeks.
- Credit card spend was down 2.1% year over year, which is better than the four-week average of -3.3%. Transactions, hovering close to the four-week average of -7.7%, finished down 6.5%.
- Consumers continue strong usage of contactless, mobile wallets and card-not-present (CNP) alternatives, while continuing to use less cash.
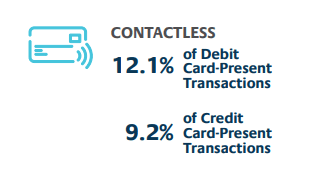
- Contactless “tap-and-go” transactions via dual interface cards continue to gain adoption. Debit contactless transactions have grown from around 8% in mid-January to 12.1% of card-present activity on contactless debit cards. Contactless credit transactions have also grown from 6.5% to 9.2% of card-present activity on contactless credit cards.
- Mobile wallet (i.e. “Pays”) transactions and purchases continue to trend up for both credit and debit cards. Debit mobile wallet purchases finished Week 32 up 76.6%. Credit mobile wallet purchases are up 48.2% year over year, in line with the prior four-week average of 48%. These results represent six supported mobile wallets: Apple Pay, Fitbit Pay, Garmin Pay, Google Pay, LG Pay and Samsung Pay.
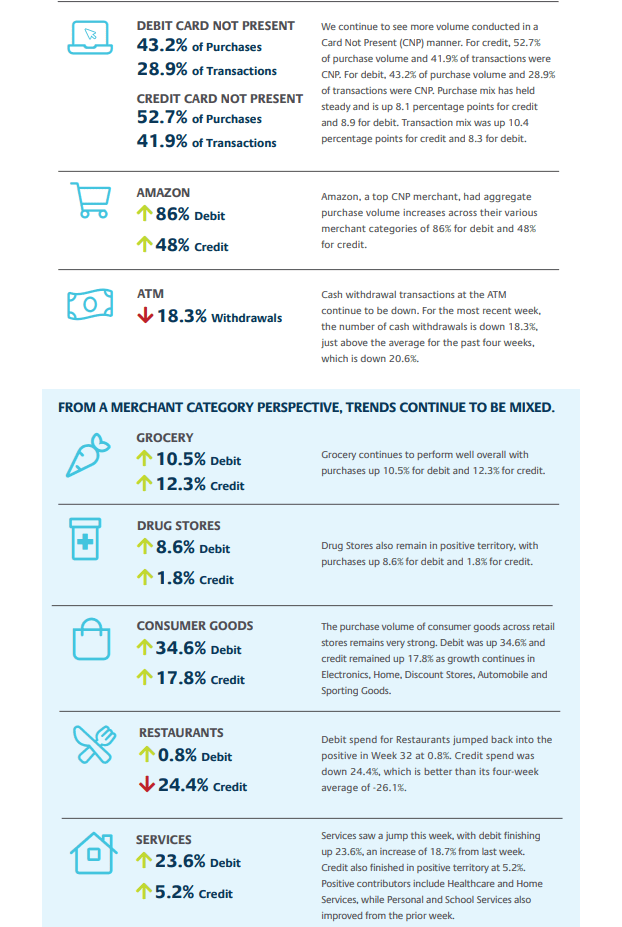
- We continue to see more volume conducted in a Card Not Present (CNP) manner. For credit, 52.7% of purchase volume and 41.9% of transactions were CNP. For debit, 43.2% of purchase volume and 28.9% of transactions were CNP. Purchase mix has held steady and is up 8.1 percentage points for credit and 8.9 for debit. Transaction mix was up 10.4 percentage points for credit and 8.3 for debit.
- Amazon, a top CNP merchant, had aggregate purchase volume increases across their various merchant categories of 86% for debit and 48% for credit.
- Cash withdrawal transactions at the ATM continue to be down. For the most recent week, the number of cash withdrawals is down 18.3%, just above the average for the past four weeks, which is down 20.6%.
- From a merchant category perspective, trends showed some increases relative to the overall pick-up in growth compared to the previous week.
- Grocery continues to perform well overall with purchases up 10.5% for debit and 12.3% for credit.
- Drug Stores also remain in positive territory, with purchases up 8.6% for debit and 1.8% for credit.
- The purchase volume of consumer goods across retail stores remains very strong. Debit was up 34.6% and credit remained up 17.8% as growth continues in Electronics, Home, Discount Stores, Automobile and Sporting Goods.
- Debit spend for Restaurants jumped back into the positive in Week 32 at 0.8%. Credit spend was down 24.4%, which is better than its four-week average of -26.1%.
- Services saw a jump this week, with debit finishing up 23.6%, an increase of 18.7 percentage points from last week. Credit also finished in positive territory at 5.2%. Positive contributors include Healthcare and Home Services, while Personal and School Services also improved from the prior week.
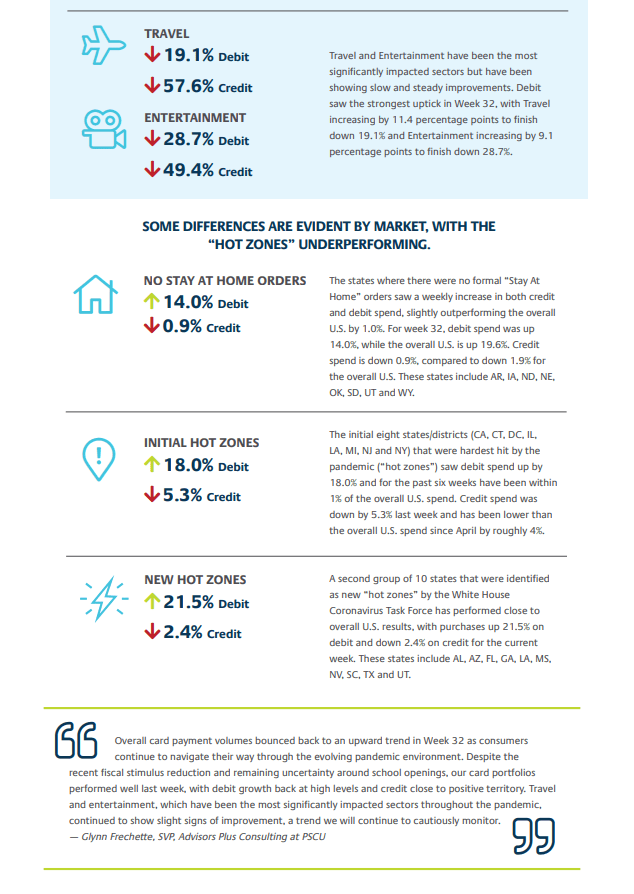
- Travel and Entertainment have been the most significantly impacted sectors but have been showing slow and steady improvements. Debit saw the strongest uptick in Week 32, with Travel increasing by 11.4 percentage points to finish down 19.1% and Entertainment increasing by 9.1 percentage points to finish down 28.7%.
- Some differences are evident by market, with the “hot zones” generally underperforming.
- Overall U.S. spend was up 19.6% for debit and down 1.9% for credit.
- The initial eight states/districts (CA, CT, DC, IL, LA, MI, NJ and NY) that were hardest hit by the pandemic (“hot zones”) saw debit spend up by 18% and for the past six weeks have been within 1% of the overall U.S. spend. Credit spend was down by 5.3% last week and has been lower than the overall U.S. spend since April by roughly 4%.
- The states where there were no formal “Stay At Home” orders saw a weekly increase in both credit and debit spend, slightly outperforming the overall U.S. by 1%. For week 32, debit spend was up 14%, while the overall U.S. is up 19.6%. Credit spend is down 0.9%, compared to down 1.9% for the overall U.S. These states include AR, IA, ND, NE, OK, SD, UT and WY.
- A second group of 10 states that were identified as new “hot zones” by the White House Coronavirus Task Force has performed close to overall U.S. results, with purchases up 21.5% on debit and down 2.4% on credit for the current week. These states include AL, AZ, FL, GA, LA, MS, NV, SC, TX and UT.
- PSCU’s Weekly U.S. State/Territory Analysis is available on www.pscu.com/covid19, ranking U.S. states and territories by year-over-year performance for debit purchases, credit purchases and ATM transactions.
“Overall card payment volumes bounced back to an upward trend in Week 32 as consumers continue to navigate their way through the evolving pandemic environment,” said Glynn Frechette, SVP, Advisors Plus at PSCU. “Despite the recent fiscal stimulus reduction and remaining uncertainty around school openings, our card portfolios performed well last week, with debit growth back at high levels and credit close to positive territory. Travel and entertainment, which have been the most significantly impacted sectors throughout the pandemic, continued to show slight signs of improvement, a trend we will continue to cautiously monitor.”
PSCU will continue to develop and share analysis of transaction trends on a regular basis.