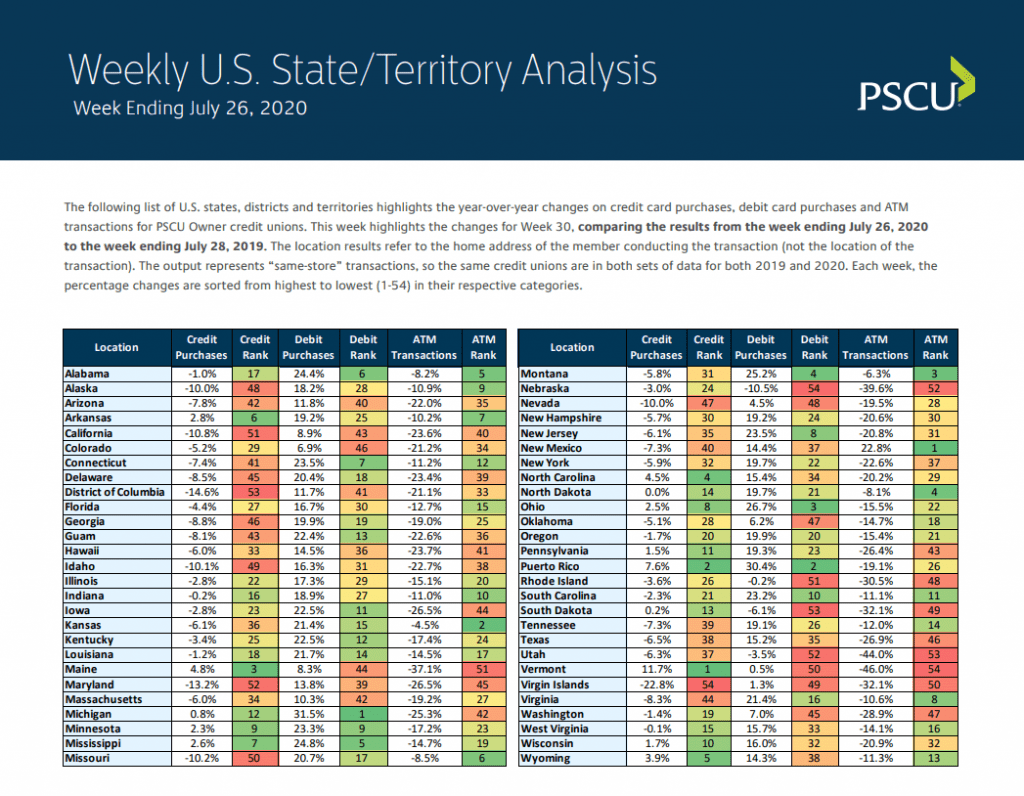
To provide relevant updates on market performance, experts from PSCU’s Advisors Plus and Data & Analytics teams today released year-over-year weekly performance data trends. In this week’s installment, PSCU compares the 30th week of the year (the week ending July 26, 2020 compared to the week ending July 28, 2019).
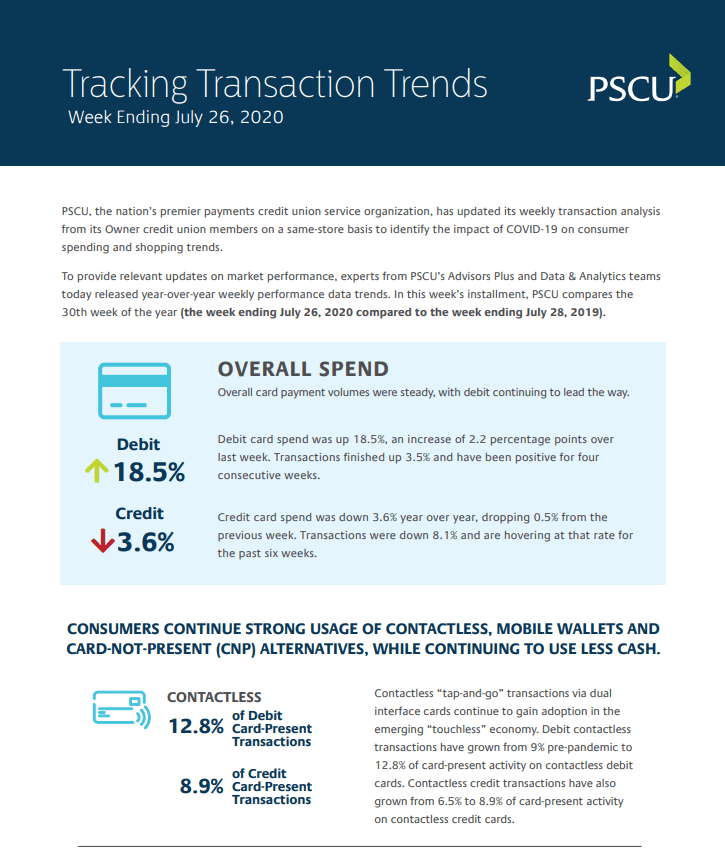
- Overall card payment volumes were steady, with debit continuing to lead the way.
- Debit card spend was up 18.5%, an increase of 2.2% over last week. Transactions were up 3.5% and have been positive for four consecutive weeks.
- Credit card spend was down 3.6% year over year, dropping 0.5% from the previous week. Transactions were down 8.1% and have been hovering at that rate for the past six weeks.
- Consumers continue strong usage of contactless, mobile wallets and card-not-present (CNP) alternatives, while continuing to use less cash.
- Contactless “tap-and-go” transactions via dual interface cards continue to gain adoption in the emerging “touchless” economy. Debit contactless transactions have grown from 9% pre-pandemic to 12.8% of card-present activity on contactless debit cards. Contactless credit transactions have also grown from 6.5% to 8.9% of card-present activity on contactless credit cards.
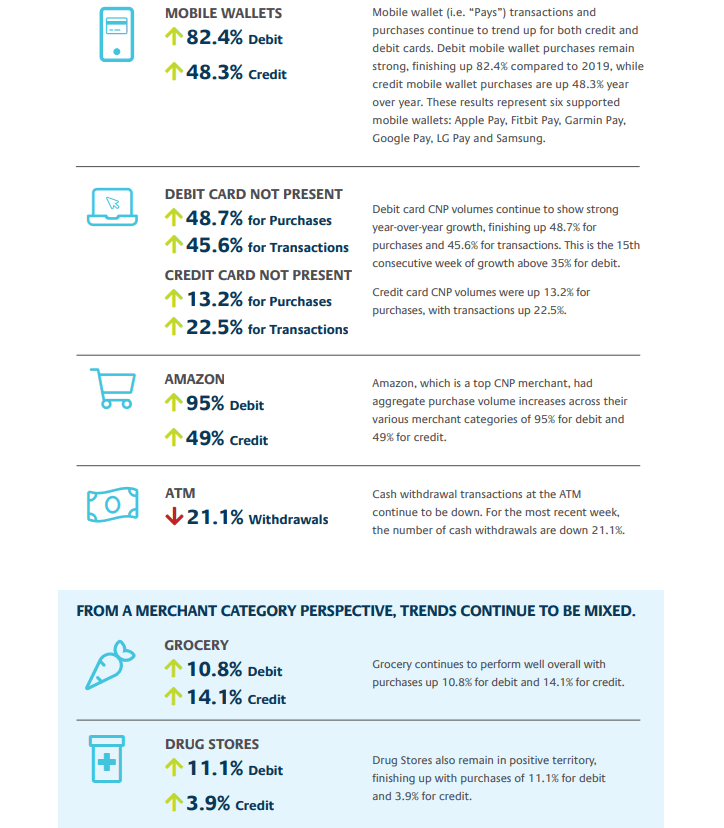
- Mobile wallet (i.e. “Pays”) transactions and purchases continue to trend up for both credit and debit cards. Debit mobile wallet purchases remain strong, finishing up 82.4% compared to 2019, while credit mobile wallet purchases are up 48.3% year over year. These results represent six supported mobile wallets: Apple Pay, Fitbit Pay, Garmin Pay, Google Pay, LG Pay and Samsung.
- Debit card CNP volumes continue to show strong year-over-year growth, finishing up 48.7% for purchases and 45.6% for transactions. This is the 15th consecutive week of growth above 35% for debit.
- Credit card CNP volumes were up 13.2% for purchases, with transactions up 22.5%.
- Amazon, which is a top CNP merchant, had aggregate purchase volume increases across their various merchant categories of 95% for debit and 49% for credit.
- Cash withdrawal transactions at the ATM continue to be down. For the most recent week, the number of cash withdrawals are down 21.1%.
- From a merchant category perspective, trends are steady.
- Grocery continues to perform well overall with purchases up 10.8% for debit and 14.1% for credit.
- Drug Stores also remain in positive territory, finishing up with purchases of 11.1% for debit and 3.9% for credit.
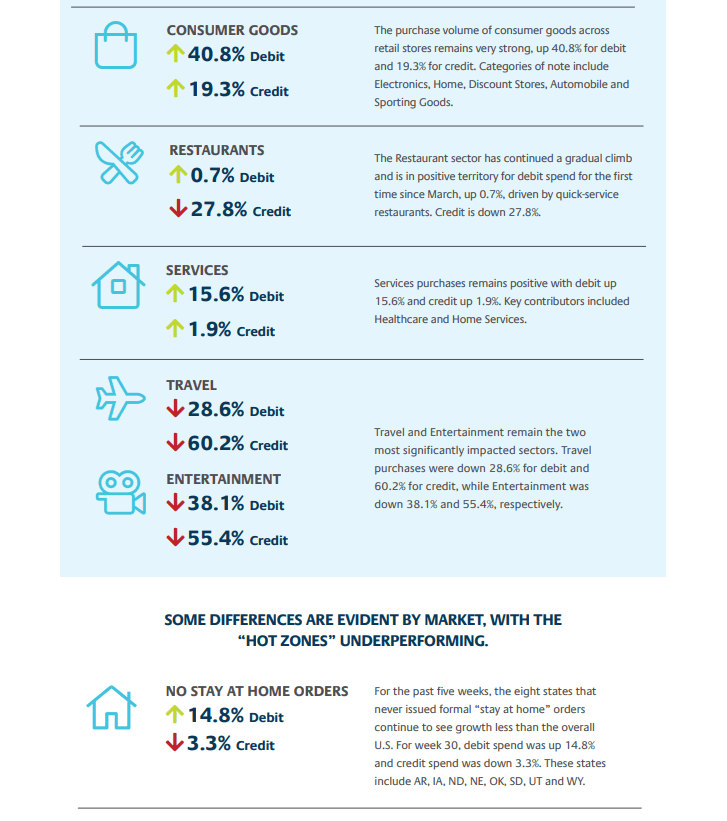
- The purchase volume of consumer goods across retail stores remains very strong, up 40.8% for debit and 19.3% for credit. Categories of note include Electronics, Home, Discount Stores, Automobile and Sporting Goods.
- The Restaurant sector has continued a gradual climb and is in positive territory for debit spend for the first time since March, up 0.7%, driven by quick-service restaurants. Credit is down 27.8%.
- Services purchases remains positive with debit up 15.6% and credit up 1.9%. Key contributors include Healthcare and Home Services.
- Travel and Entertainment remain the two most significantly impacted sectors. Travel purchases were down 28.6% for debit and 60.2% for credit, while Entertainment was down 38.1% and 55.4%, respectively.
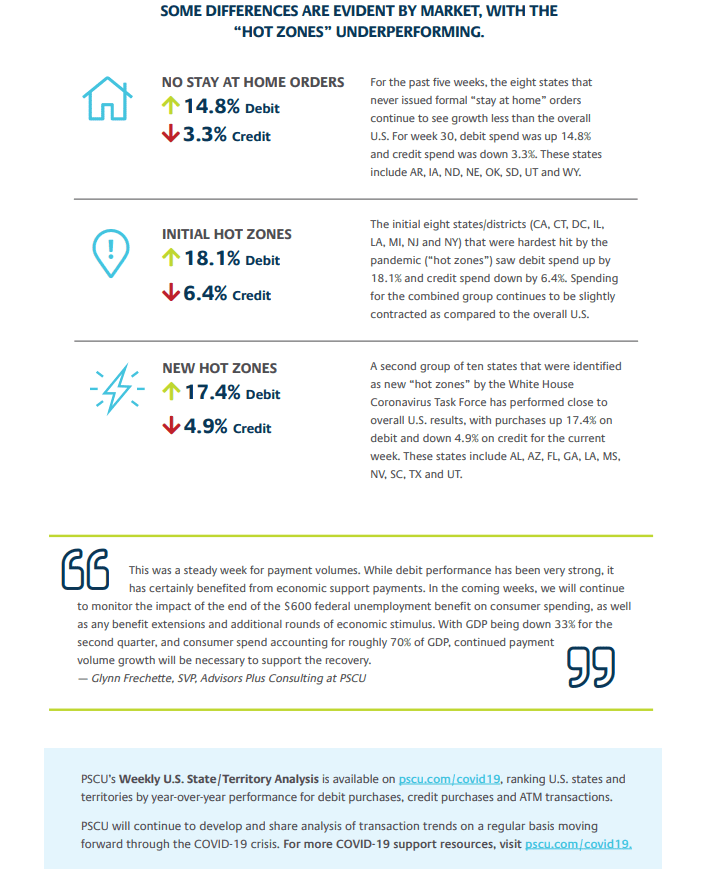
- Some differences are evident by market, with the “hot zones” underperforming.
- Overall U.S. spend was up 18.6% for debit and down 3.4% for credit.
- The initial eight states/districts (CA, CT, DC, IL, LA, MI, NJ and NY) that were hardest hit by the pandemic (“hot zones”) saw debit spend up by 18.1% and credit spend down by 6.4%. Spending for the combined group continues to be slightly contracted as compared to the overall U.S.
- For the past five weeks, the eight states that never issued formal “stay at home” orders continue to see growth less than the overall U.S. For week 30, debit spend was up 14.8% and credit spend was down 3.3%. These states include AR, IA, ND, NE, OK, SD, UT and WY.
- A second group of ten states that were identified as new “hot zones” by the White House Coronavirus Task Force has performed close to overall U.S. results, with purchases up 17.4% on debit and down 4.9% on credit for the current week. These states include AL, AZ, FL, GA, LA, MS, NV, SC, TX and UT.
- PSCU’s Weekly U.S. State/Territory Analysis is available on PSCU.com/COVID19, ranking U.S. states and territories by year-over-year performance for debit purchases, credit purchases and ATM transactions.
“This was a steady week for payment volumes. While debit performance has been very strong, it has certainly benefited from economic support payments,” said Glynn Frechette, SVP, Advisors Plus at PSCU. “In the coming weeks, we will continue to monitor the impact of the end of the $600 federal unemployment benefit on consumer spending, as well as any benefit extensions and additional rounds of economic stimulus. With GDP being down 33% for the second quarter, and consumer spend accounting for roughly 70% of GDP, continued payment volume growth will be necessary to support the recovery.” PSCU will continue to develop and share analysis of transaction trends on a regular basis.