As the economic impact of the COVID-19 pandemic continues to grow, PSCU, the nation’s premier payments credit union service organization, updated its weekly transaction analysis from its Owner credit union members on a same-store basis to identify the impact of COVID-19 on consumer spending and shopping trends.
To provide relevant updates on market performance, experts from PSCU’s Advisors Plus and Data & Analytics teams today released year-over-year weekly performance data trends. In this week’s installment, PSCU compares the 17th week of the year (the week ending April 26, 2020 compared to the week ending April 28, 2019).
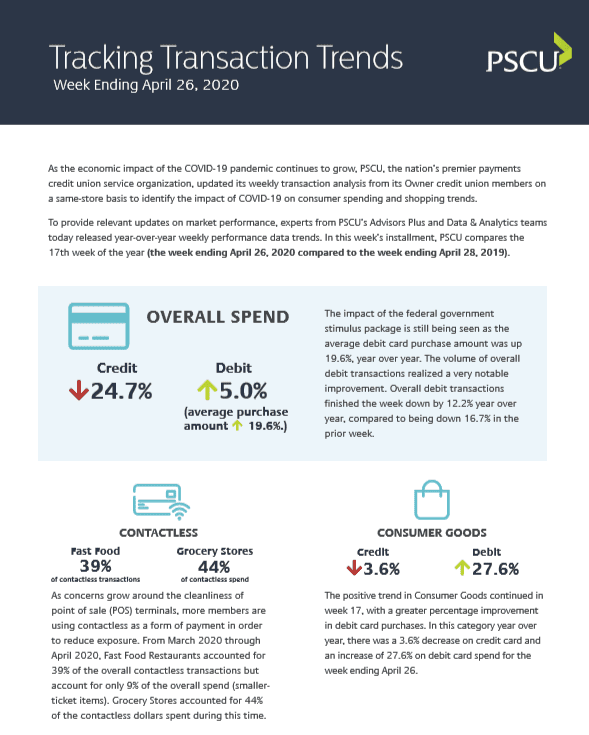
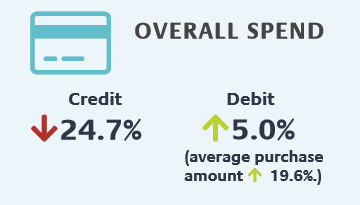
- Overall credit card spend was down 24.7%, a notable improvement compared to the prior week, and overall debit card spend was up 5.0% year over year.
- The impact of the federal government stimulus package is still being seen as the average debit card purchase amount was up 19.6%, year over year. The volume of overall debit transactions realized a very notable improvement. Overall debit transactions finished the week down by 12.2% year over year, compared to being down 16.7% in the prior week.
- The positive trend in consumer goods continued in week 17, with a greater percentage improvement in debit card purchases. In this category year over year, there was a 3.6% decrease on credit card and an increase of 27.6% on debit card spend for the week ending April 26.
- As concerns grow around the cleanliness of point-of-sale (POS) terminals, more members are using contactless as a form of payment in order to reduce exposure.
- From March 2020 through April 2020, fast food restaurants accounted for 39% of the overall contactless transactions but account for only 9% of the overall contactless spend (smaller-ticket items)
- Grocery stores accounted for 44% of the contactless dollars spent during this time
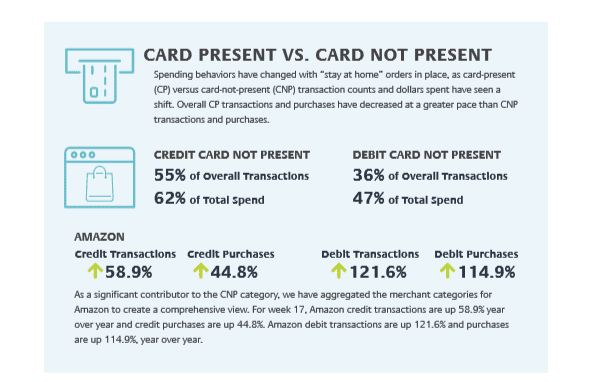
- Spending behaviors have changed with “stay at home” orders in place, as card-present (CP) versus card-not-present (CNP) transaction counts and dollars spent have seen a shift. Overall CP transactions and purchases have decreased at a greater pace than CNP transactions and purchases.
- In week 17, Credit CNP transactions account for 55% of overall credit transactions and Credit CNP purchases account for 62% of the total spend.
- Debit CNP transactions account for 36% of overall debit transactions and Debit CNP purchases account for 47% of the total spend.
- As a significant contributor to the CNP category, we have aggregated the merchant categories for Amazon to create a comprehensive view. For week 17, Amazon credit transaction are up 58.9% year over year and credit purchases are up 44.8%. Amazon debit transactions are up 121.6% and purchases are up 114.9%, year over year.
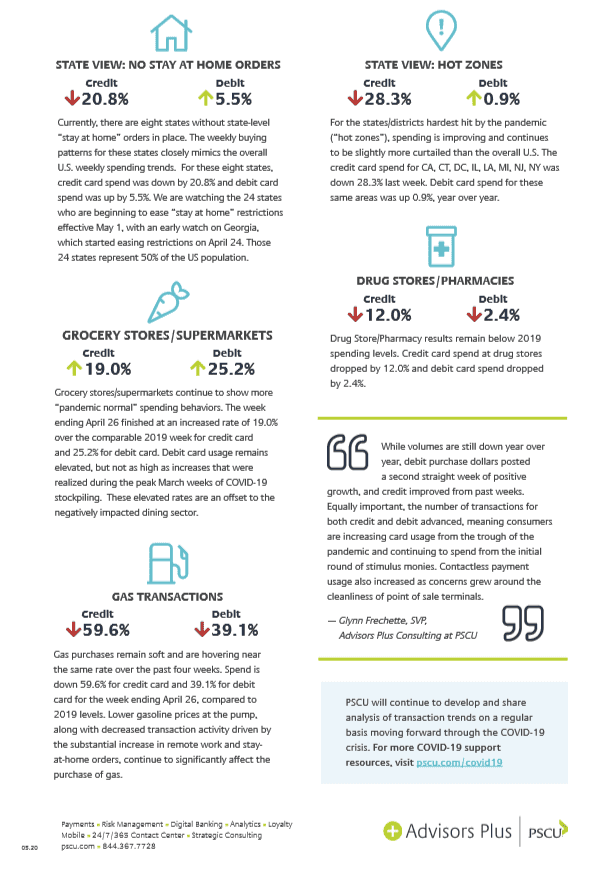
- Currently, there are eight states without state-level “stay at home” orders in place. The weekly buying patterns for these states closely mimics the overall U.S. weekly spending trends. For these eight states, credit card spend was down by 20.8% and debit card spend was up by 5.5%. We are watching the 24 states who are beginning to ease “stay at home” restrictions effective May 1, with an early watch on Georgia, which started easing restrictions on April 24. Those 24 states represent 50% of the U.S. population.
- For the states/districts hardest hit by the pandemic (“hot zones”), spending is improving and continues to be slightly more curtailed than the overall U.S. The credit card spend for CA, CT, DC, IL, LA, MI, NJ, NY was down 28.3% last week. Debit card spend for these same areas was up 0.9%, year over year.
- Grocery stores/supermarkets continue to show more “pandemic normal” spending behaviors. The week ending April 26 finished at an increased rate of 19.0% over the comparable 2019 week for credit and 25.2% for debit. Debit card usage remains elevated, but not as high as increases that were realized during the peak March weeks of COVID-19 stockpiling. These elevated rates are an offset to the negatively impacted dining sector.
“While volumes are still down year over year, debit purchase dollars posted a second straight week of positive growth, and credit improved from past weeks,” said Glynn Frechette, senior vice president, Advisors Plus at PSCU. “Equally important, the number of transactions for both credit and debit increased, meaning consumers are using their cards more frequently and continuing to spend from the initial round of stimulus monies. Contactless payment usage also increased as concerns grew around the cleanliness of point-of-sale terminals.”
PSCU will continue to develop and share analysis of transaction trends on a regular basis throughout the COVID-19 crisis.