PSCU, the nation’s premier payments credit union service organization, has updated its weekly transaction analysis from its Owner credit union members on a same-store basis to identify the impact of COVID-19 on consumer spending and shopping trends.
To provide relevant updates on market performance, experts from PSCU’s Advisors Plus and Data & Analytics teams today released year-over-year weekly performance data trends. In this week’s installment, PSCU compares the 42nd week of the year (the week ending October 18, 2020 compared to the week ending October 20, 2019).
Card payment volume growth rates continued to show overall strength in Week 42, with debit rising slightly and credit showing continued positive growth.
- Debit card spend was up 15.7%, slightly lower than the four-week average of +16.2%. Transactions were up 3.5% and have been positive for 16 consecutive weeks.
- Credit card spend achieved its seventh consecutive week of positive growth at +6.5%, which is higher than the four-week average of +4.3%. Transactions finished up 1.2%, moving into positive territory for the first time since the week of the Labor Day holiday.
Consumers continue strong usage of contactless, mobile wallets and card-not-present (CNP) alternatives, while using less cash.
- Contactless “tap-and-go” transactions via dual interface cards continue to gain adoption. Debit contactless transactions as a percent of card-present activity on contactless debit cards have more than doubled from around 8.4% in mid-January to 17% in Week 42. Contactless credit transactions have also grown from 6.5% in mid-January to last week finishing at 10.6% of card-present activity on contactless credit cards.
- Mobile wallet (i.e. “Pays”) transactions and purchases for both credit and debit cards continue to show positive results. Debit mobile wallet purchases finished Week 42 up 63.3% year over year, lower than the four-week average of +66.7%. Credit mobile wallet purchases were up 52.9% year over year, slightly higher than the four-week average of +51.2%. These results represent six supported mobile wallets: Apple Pay, Fitbit Pay, Garmin Pay, Google Pay, LG Pay and Samsung Pay.
- We continue to see more volume conducted via Card Not Present (CNP) transactions. For credit, 52.7% of purchase volume and 42.4% of transactions were CNP. For debit, 42.2% of purchase volume and 29% of transactions were CNP. Purchase mix has held steady and is up 7.2 percentage points year over year for credit and 7.1 percentage points for debit. Transaction mix also remains steady, up 9.4 percentage points for credit and 7.2 percentage points for debit year over year.
- Cash withdrawal transactions at the ATM remain down year over year. For the most recent week, the number of cash withdrawals was down 19.9%, in line with the past four weeks of -19.6%. The year-over-year change in total cash withdrawn is down 10.6%, which is in line with the four-week average of -10%.
From a merchant category perspective, purchase growth rates in Week 42 remained steady, influenced by Amazon Prime Day on October 13-14.
- Goods showed strong performance this week. Purchases are up 32.8% for debit, an increase of 2.1 percentage points from the previous week and credit is up 29.8%, an increase of 8.4 percentage points.
- Entertainment remains substantially down year over year. For Week 42, purchases are below 2019 levels by 46.1% for credit and down 25.4% for debit.
- Spend in the Service sector slightly declined in both debit and credit, down from the high levels last week but remaining relatively steady overall. Purchases are up 13.7% for debit, a decrease of 7 percentage points week over week. Credit purchases were up 9.5%, down 1.3 percentage points from the previous week.
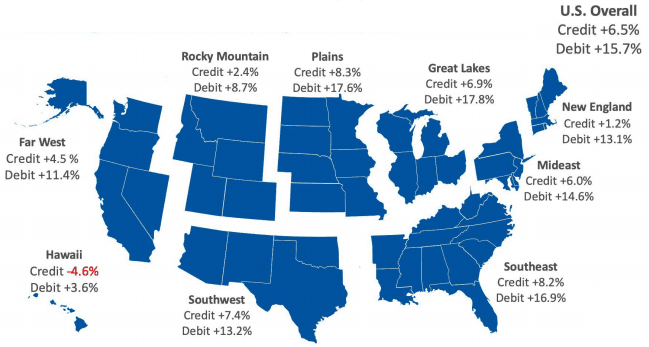
Our regional analysis of spend utilizes the segmentation used by the U.S. Bureau of Economic Analysis (BEA) for economic analysis. Please see the attached infographic for a map of changes to credit and debit purchases by region.
- Overall U.S. spend was up 6.5% for credit purchases. The Plains (+8.3%) and the Southeast (+8.2%) finished as the strongest regions for Week 42. The Hawaii (-4.6%), New England (+1.2%), and Rocky Mountain (+2.4%) regions had the lowest credit purchase performance.
- Overall U.S. spend was up 15.7% for debit purchases. The Great Lakes (+17.8%), Plains (+17.6%), Southeast (+16.9%) and the Southwest (+13.2%) finished as the strongest regions for Week 42. The Hawaii (+3.6%), Rocky Mountain (+8.7%) and Far West (+11.4%) regions had the lowest debit purchase performance.
PSCU’s Weekly U.S. State/Territory Analysis is available at www.PSCU.com/COVID19, ranking U.S. states and territories by year-over-year performance for debit purchases, credit purchases and ATM transactions.
This week’s deeper dive explores Amazon Prime Day 2020, Amazon’s biggest sale event of the year that occurred October 13-14, 2020. For Week 42, Amazon.com represented 7.19% of PSCU total credit purchases and 4.69% of PSCU total debit purchases.
- In reviewing the performance of Prime Day 2020, purchases are up, yet explosive growth is not expected as in prior years. This can likely be attributed to several dynamics, including the different time period of this year’s Prime Day event and consumers’ more frequent use of Amazon throughout the pandemic.
- As Citi analysts noted in research published late last week, Amazon’s own messaging around Prime Day 2020 was more muted than previous years, highlighting the boost for third-party sellers and the sales generated for small and medium-sized businesses (SMBs) selling on the platform. We will continue to monitor Prime Day performance into the coming week, as Amazon sales are accounted for upon shipment, which for SMB sellers may have been outside the two-day Prime Day window.
Exploring the increases in Prime Day purchases, we look at three comparisons to provide a holistic view of this year’s event:
- Amazon Prime Day Week, Year over Year: In 2019, Prime Day occurred during Week 29 on July 15-16. When comparing Week 42 of 2020 with Week 29 of 2019, credit purchases were up 42.4% with average purchase amount up 0.2%, finishing at $45.21. For debit, purchases are up 69.8%, with the average purchase up 3.2% at $34.66.
- Amazon Results for Week 42, Year over Year: While Prime Day did not occur in the same week in 2019, we maintain our consistency in reporting year-over-year changes for Week 42, isolating Amazon as a merchant. For credit, purchases are up 115.4% with the average purchase size up 21.1%, finishing at $45.21. For debit, purchases are up 121.2% with the average purchase size up 19.5%, finishing at $34.66.
- Amazon Prime Day 2020: Week 42 vs. Recent Four-Week Average: In 2020’s pandemic environment, this analysis compares the recent Amazon four-week average (Weeks 38 to 41) to the week of Prime Day (Week 42). For credit, purchases are up 46.0% with the average purchase size up 13.9%, finishing at $45.21. For debit, purchases are up 36.6% with the average purchase size up 11.5%, finishing at $34.66.
“Both debit and credit purchase volume continued to perform well in Week 42, with credit transactions moving into positive territory for the first time since the Labor Day holiday, strengthened by Amazon Prime Day 2020.”
“This week’s deeper dive into Amazon Prime Day shows an increase in purchases, if not the extraordinary results we have seen in prior years, which can likely be attributed to the different time period of this year’s Prime Day event and consumers’ already elevated use of Amazon throughout the pandemic. We’ll continue to monitor these trends as results from this year’s event are finalized.”
Glynn Frechette, SVP, Advisors Plus at PSCU.
PSCU will continue to develop and share analysis of transaction trends on a regular basis.